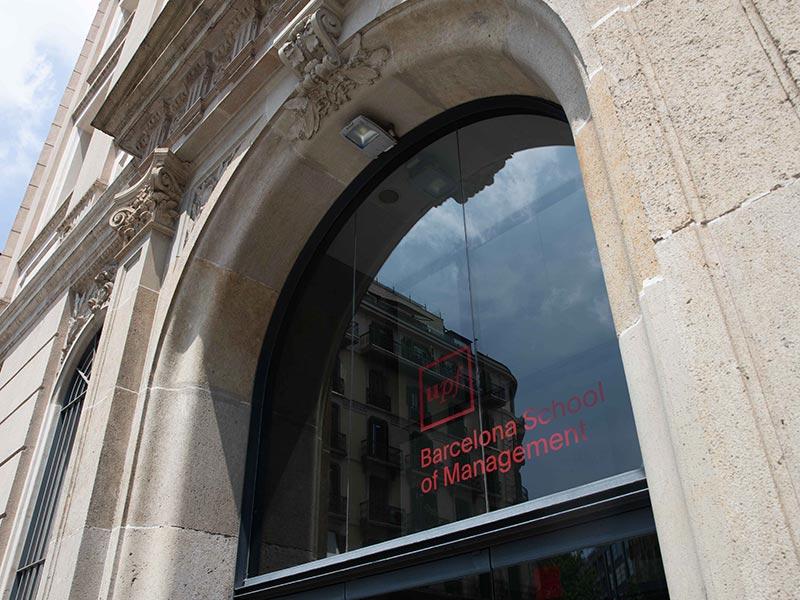
- About UPF-BSM
- Programs
- Faculty and research
- Companies and Organizations
- News & Events

At UPF Barcelona School of Management (UPF-BSM) we are committed to constantly improving the governance of our organization, our degree plan, our faculty and our training model. It is a commitment to excellence with the students who choose us and with all the stakeholders of the institution.
Also, the care for organizational culture and processes drives us to evolve towards more agile, flexible and fluid organizational models that allow us to transform and adapt quickly to change.
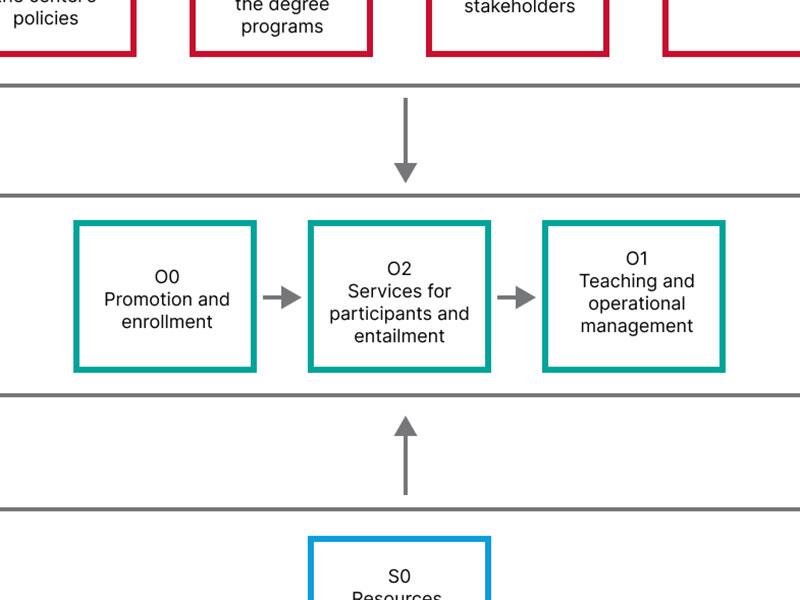
To guarantee this continuous improvement, a Quality Commission reviews and approves our self-evaluation and accreditation processes. This review ensures that the professional university education we provide is adequate and meets the expectations of the labor market and today's society.
Quality Committee
The Quality Committee is made up of representatives from the academic and management areas, with the participation of UPF-BSM students and Alumni.
Responsibilities
UPF-BSM's Quality Committee is responsible for analyzing, reviewing, approving and following up on documents that accredit the quality of our school.
Members
This Committee is made up of the following members: other participants may be invited depending on the topics to be dealt with (Technical Quality Office, etc.).
Quality reports


Assessment and indicators

Master of Science in Finance and Banking
The program provides our students with the necessary skills for solid decision-making in finance, banking, and financial regulation.

Master of Science in Management
The programme focuses on the pillars of business management, strategic management, innovation, and consulting, building a solid foundation for understanding business organizations as a whole.


Master of Science in Marketing
The program offers an analytical approach to Marketing, providing students with the technical and creative skills needed to understand how to satisfy customer needs from a strategic, managerial, and empirical perspective.

Master of Science in Sustainability Management
Built to empower professionals to embed sustainability—economic, social, and environmental—into corporate strategy through real-world cases, advanced technical tools, professional internships, and guided mentoring.

Master of Arts in Communication Management
Internationally oriented and with a hands-on approach: learn the skills required to plan, develop and implement corporate and digital communication strategies.

Full Time MBA in english
Program designed to specialize in global strategic management, responsible leadership, and innovative thinking through active learning, real‑world projects, international trips, and personalized mentoring.

Full Time MBA
Program designed to specialize in management concepts, techniques, and tools applied to strategic leadership, decision-making, and business management in international environments.

Executive MBA (EMBA)
Management development program that allows our students to give the ultimate boost to their professional career and prepares them to lead companies with a global and innovative vision.

Master in Health Economics and Pharmacoeconomics
The program is designed for specialising training in health economics, economic evaluation, and management of health services and technologies.

Master in Health Economics and Pharmacoeconomics
The program offers specialist training in health economics, economic evaluation, and management of health services and technologies.

Master in International Business
With this master our students improve their management skills and discover how to analyse business opportunities on each continent, adapting to their business models.

Master in Supply Chain Management, Technology and Sustainability
Designed to cultivate professionals skilled in designing and managing efficient, tech-enabled, and sustainable supply chains, blending master classes, real-world cases, simulations, logistics site visits (including a Barcelona–Italy voyage), and corporate internships.

Master in Project Management and Culture of Change
Designed to equip professionals with the skills to lead complex projects and inspire change management cultures, merging traditional project techniques (scope, time, budget, PMI) with agile and design thinking methodologies, through real‑world simulations, company visits, internships, and mentoring.

Master in Data Analytics for Business
Program aimed at training specialists in data extraction, analysis, and strategic application through advanced tools in artificial intelligence and business intelligence, with a hands-on approach, official certifications, and company internships.

Master in Finance and Banking
The program prepare our students to be an investment fund manager, bank manager, personal advisor, or expert in the new disruptive platforms in the sector.

Master in Accounting and Financial Management
The main objective of the program is to train expert professionals who can successfully manage the accounting and financial department of any company or institution.

Master in Auditing and Financial Management
The program offers our students a consolidated programme with complete and updated content, reviewed by the REA and today's major auditing firms and internships so that they can enter a sector with a high demand for professionals.

Master in Marketing
The program provides our students with the practical and strategic foundations to run a marketing department, incorporating the latest trends and tools from both online marketing and the latest offline marketing and communication techniques.

Master in Digital Information
Program with specialization in Digital Documentation and specialization in UX (Usability, Interaction Design, User Experience and Positioning).

Master's Degree in Spanish Legal Professions (Abogado & Procurador)
The reference program in the training of lawyers and legal representatives (procuradores). The program trains our students in the core areas of litigation, professional ethics, and business legal advice.

Online Master in Public Administration and Government in Latin America
Program that provides practical tools for the design of government structures and public policy instruments, and to improve governance and innovation in public management.

Master in Public and Social Policies
Program offered in collaboration with Johns Hopkins University, two international reference institutions that occupy very prominent positions in the different research and teaching rankings.

Master in Communication Management and Business Relations
Aimed at training professionals to manage corporate and commercial communication in multicultural environments, with a special focus on relations between Asia and the Spanish-speaking world, through practical learning and professional connections.
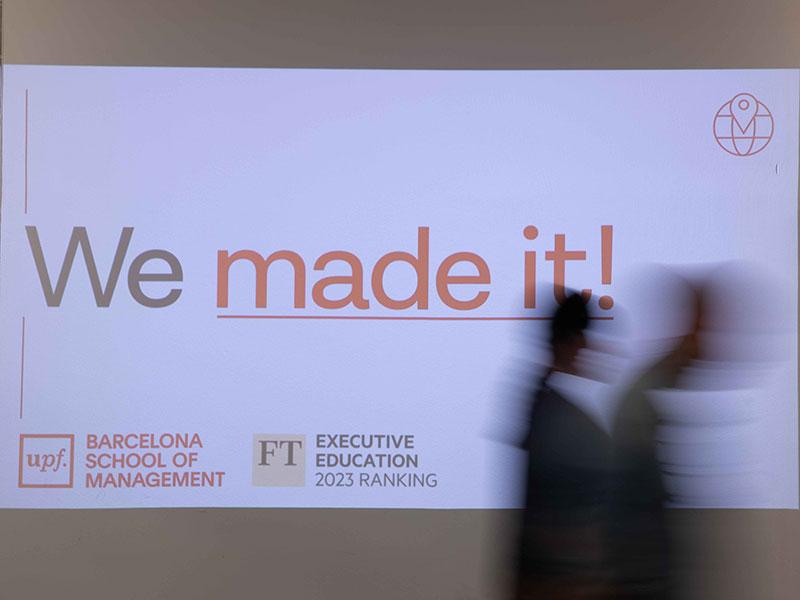
Accreditations
Our institution has the dual accreditation of AMBA and EQUIS, two of the three most prestigious academic accolades in the sector, confirming our status as one of the top business schools in the world.
AQU SGIC Accreditation
We are one of the 10 centers institutionally accredited by the Quality Agency of the University System of Catalonia (AQU).
AQU Center Accreditation
This institutional accreditation by AQU Catalunya means that we are accredited for all official university bachelor's and master's degrees for a renewable period of five years.
AMBA Accreditation
The International Association of Masters in Business Administration (AMBAs & BGA) recognizes the academic quality and reputation of our programs and makes us one of only six business schools in Spain with this accreditation.
EQUIS Accreditation
The UPF Barcelona School of Management has the EQUIS accreditation, the most prestigious institutional recognition for business schools worldwide, which places it among the elite of business schools.